Gemini’s interactive visuals: 3 fun and easy things to try

So you’ve probably used Gemini to summarise a document or draft an email or do one of your assignments. Cool. Useful. Mildly impressive. But have you asked it to show you something? Because Google just quietly dropped one of the more genuinely fun AI features in a while, interactive simulations that you can actually poke, drag, and mess around with. No downloads. No coding. Just ask, and it builds you a live, interactive visual right there in the chat.
Here’s how to use it and three things worth trying first. To get started, head to gemini.google.com, make sure you’ve got the Pro model selected in the prompt bar, and just ask Gemini to “show me” or “help me visualise” something. That’s it. The magic phrase is really just “show me.” You don’t need to be specific about the format, Gemini figures out what kind of visual makes sense. If used correctly, you can genuinely one of those “oh, THAT’S why” moments.
Also read: Google Gemini gets new feature to turn complex ideas into interactive visuals, here is how
The Moon doing Moon things
Type something like: “Show me how the Moon orbits the Earth”
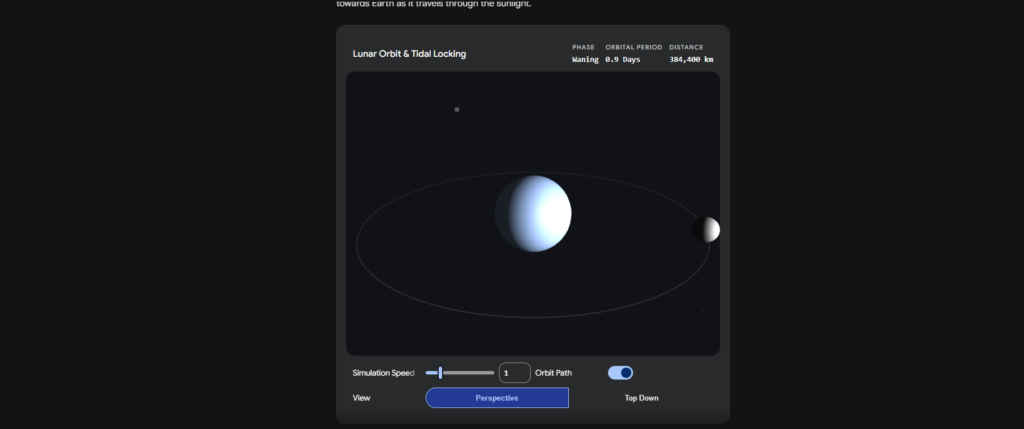
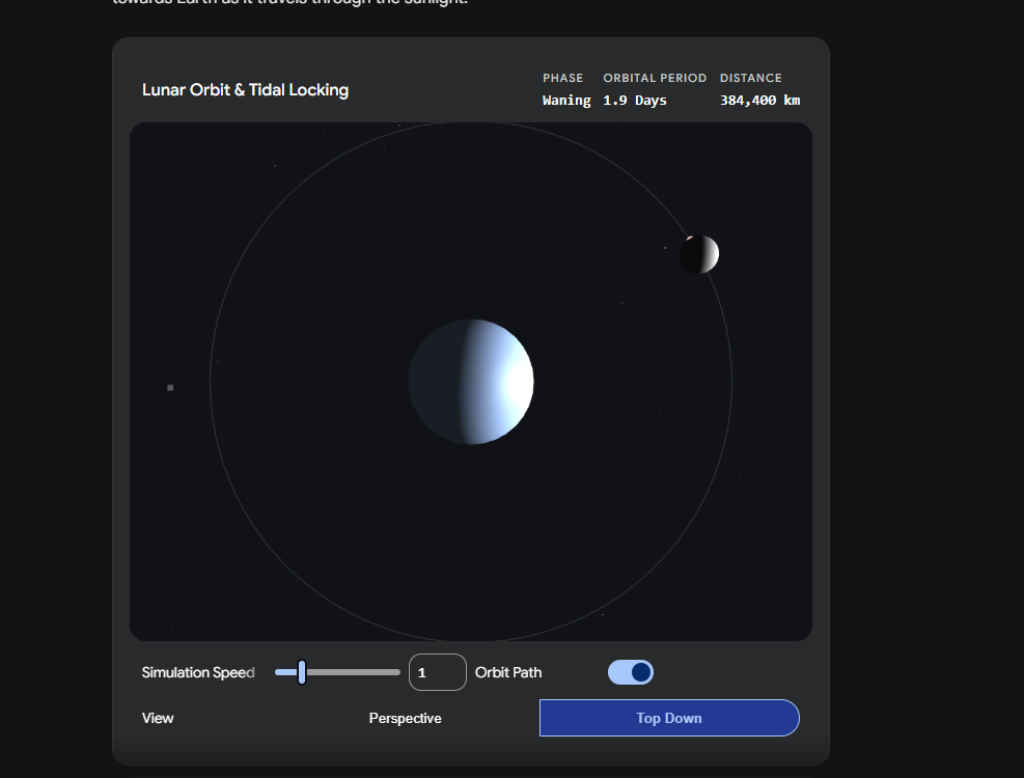
What you get is a full simulation – Earth at the centre, Moon circling around it, and live readouts for the orbital period, distance, and current phase. There’s a simulation speed slider so you can slow it way down or fast forward through the phases. You can also flip between a perspective view and top-down. The tidal locking part is the sneaky interesting bit, it shows why we always see the same face of the Moon. Something that takes three paragraphs to explain in text just… clicks when you see it animated.
Your money, but make it visual
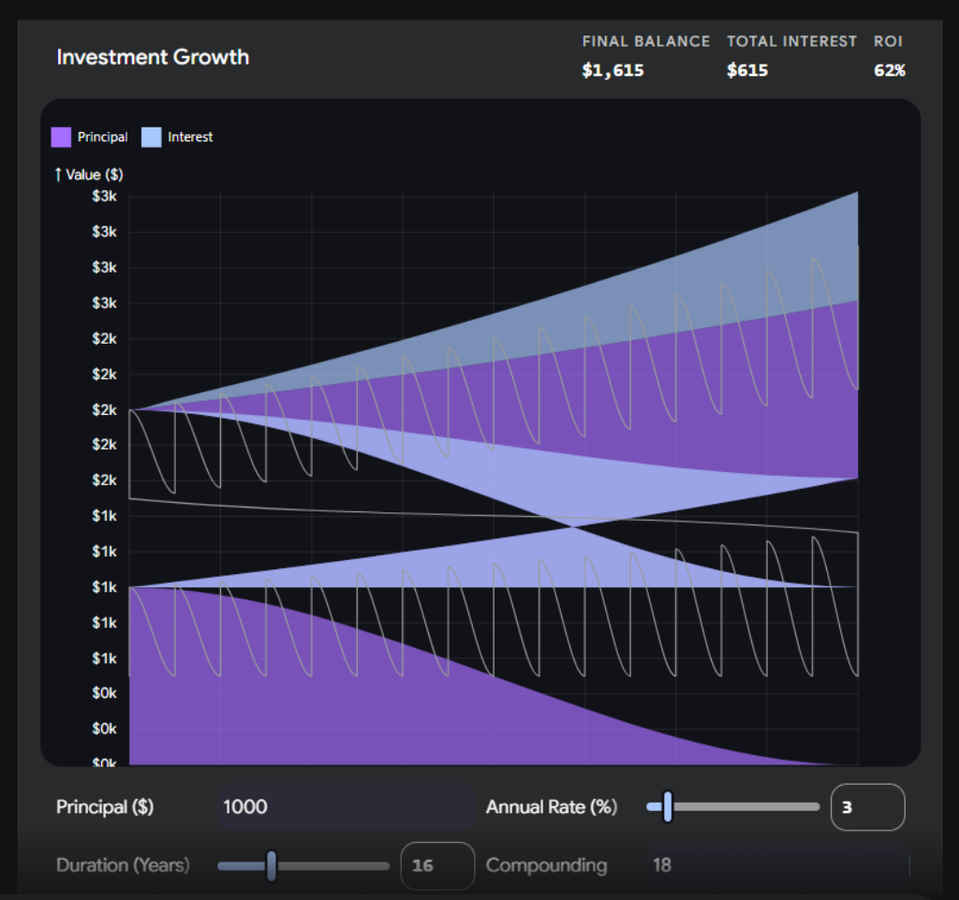
Ask: “Show me how compound interest grows over time – let me adjust the rate and duration”
Also read: You can set up Claude Managed Agents in 5 easy steps, here’s how
This one comes out looking almost too pretty, a layered area chart that splits your principal from the interest earned, with sliders for annual rate, duration, and how often it compounds. Drag the annual rate from 3% to 10% and watch the interest curve go from a gentle slope to something alarming. It’s the kind of thing a finance teacher has been trying to explain with a whiteboard for decades. It takes about four seconds here. Fair warning though if you’re staring at a low-rate savings account, this might ruin your afternoon.
Water molecule, but make it 3D

Ask: “Visualise how atoms bond to form water”
This one’s a little trippy. You get a 3D model with the oxygen atom in the centre, hydrogen atoms bonding in, electron clouds rendered as these soft glowing orbitals around the whole thing. There’s an “Initiate Formation” button that animates the bond forming step by step. You can rotate the whole thing and change the view between formation, structure, and orbital modes. It’s the kind of visual that belongs in a textbook but somehow ended up in your chat window.
None of these require any scientific background to enjoy. That’s kind of the whole point. Just ask, play around, and try not to spend an hour on the compound interest one.
Also read: Claude Managed Agents explained: Everything developers need to know