Functional Connectivity of Epileptic Brains: Extracting Functional Connectivity – Week 3 Update

In the previous week we applied preprocessing techniques to obtain the cleaned EEG data. This week we are introducing how to extract functional connectivity from the EEG data. Functional connectivity is defined as a study of the correlation of event occurring in the regions of the cortex. The value of functional connectivity depends on the levels of synchronization between groups of neurons. Therefore, the simplest way to calculate the functional connectivity between different electrodes of EEG data is by using cross-correlation.
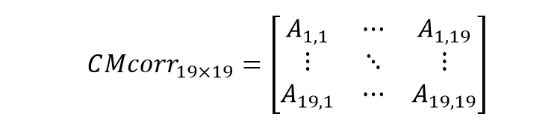
Cross-correlation can be defined as the shown equation where it measures the similarity between two signals. Cross-correlation coefficients between all pairwise montages of all 19 EEG channels were computed independently. The cross-correlation coefficient as measured between any two vectors x and ywith length n with a lag of m, where x and y in this case represent a vector of the EEG data of a pair of electrodes.

The computed coefficients were normalized where the auto-correlations at the zero lag will be identified as the highest value (R = 1.0).
The rest of the pairwise electrodes were computed in a slightly different method, where the algorithm searches for the maximum cross-correlation coefficient over the lags (m) of ± 500ms and selects the maximum value in the range to be the strength of the functional connectivity representing each pair. When we calculate all of the pair of electrodes, we will obtain the connectivity matrix.
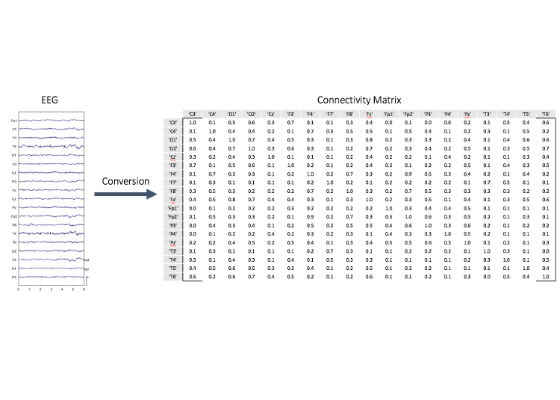
Now as shown in the figure below, we have converted the EEG data into connectivity matrix. The values of the elements in the matrix range between 0 and 1, where 1 indicates that there is a strong connection between the two electrodes and 0 indicates otherwise. We can see that the diagonal elements of the connectivity matrix contain elements with all 1 value. This happens because the maximum correlation between a signal and itself will always be the highest.
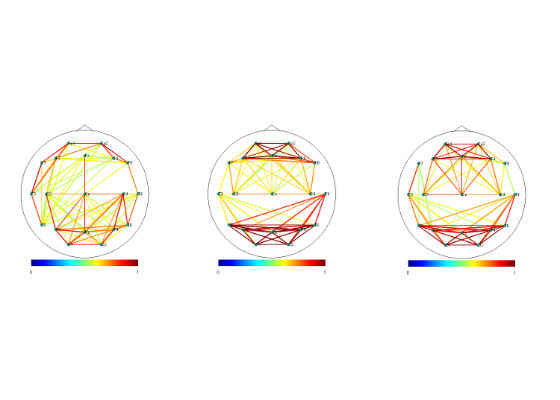
To make it easy to visualize, we can use this connectivity matrix and generate plots. Undirected graphs are constructed to provide a visualization result of connectivity matrices obtained from the proposed cross-correlation method. The electrodes are represented as the nodes of the plot where the edges provide the connection strength. The connection strength between the nodes or the edge is represented by colors, where dark blue indicates that there is no connection and dark red indicates the highest connectivity strength.
For more such intel IoT resources and tools from Intel, please visit the Intel® Developer Zone
Source: https://software.intel.com/en-us/blogs/2017/11/14/functional-connectivity-of-epileptic-brains-extracting-functional-connectivity-week