From Fitness to gameplay, track everything with charts and graphs, thanks to these tools
Using an array of tools and applications, get graphs and charts for almost every aspect of your life

We live in the age of data, and if you’re the kind that loves numbers, charts, and graphs, there hasn’t been a better time in history for you to be alive. Almost every action that you take is tracked in some way or the other on some device or platform. But what good is all that data if you cannot make any sense of it? That’s where this workshop comes in – we show you how you can track everything – and we mean EVERYTHING!
Track Finances
Almost all of us are guilty of being bad with money at some point in our lives. No? Well even if you haven’t, you’ll probably find certain tools very helpful to supercharge your already sharp money management skills. Interestingly, the increasing volume of digital transactions also makes your job easier when it comes to keeping track of your finances. Today, every transaction, card swipe, and online payment generate an SMS which gets sent to your phone and that’s exactly what apps like Walnut track to provide you with a neat overview of your finances.
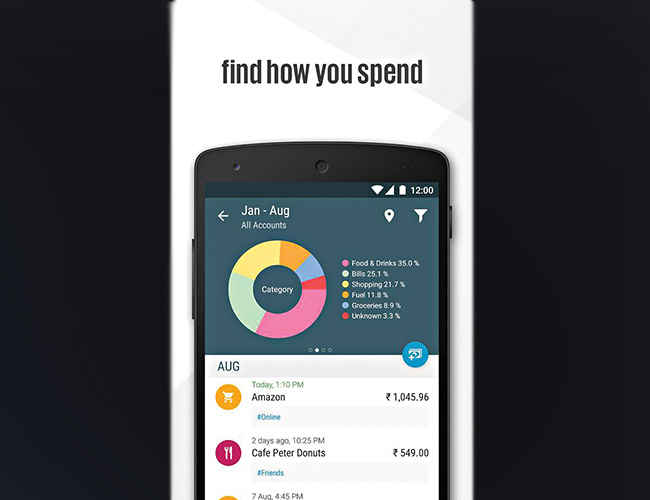
Once you’ve downloaded the app and allowed it the necessary permissions it needs, you’ll find that the app quickly generates a lot of reports and charts (from your SMS inbox) showing you your expenses across time, categories, vendors and even daily reports on how much you’re spending. Want to check how much you generally spend on food vs healthcare? You can, right down to a pie chart. Walnut pretty much takes care of all your financial tracking needs with one app.

Track Health
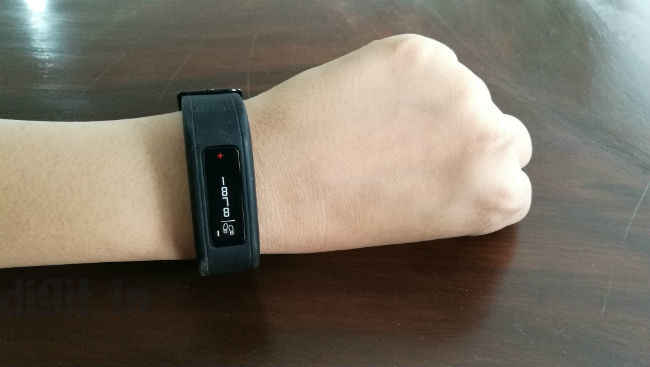
Fitness trackers are quite ubiquitous these days and almost every single one has a pretty standard set of features in step tracking, basic sleep tracking, and certain smartphone alerts. But technology is capable of much more right now. In fact, your humble smartphone can do a lot of the things that you would buy a fitness tracker for in the first place. On the other hand, there are quite a few dedicated devices that offer you a more in-depth analysis than a standard fitness tracker.
Track Sleep
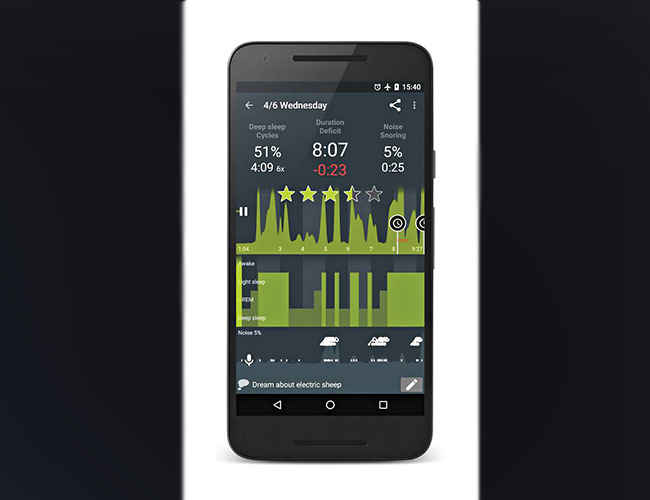
When it comes to sleep, get the Sleep as Android app from the Play Store or MotionX 24/7 from the App Store. Both apps offer in-depth sleep tracking with graphs showing you your sleep quality over the night. They also go beyond that by tracking your snoring and sleep-talking. All the data is presented in the form of easy to understand reports that will satisfy your tracking needs.
Track Workout
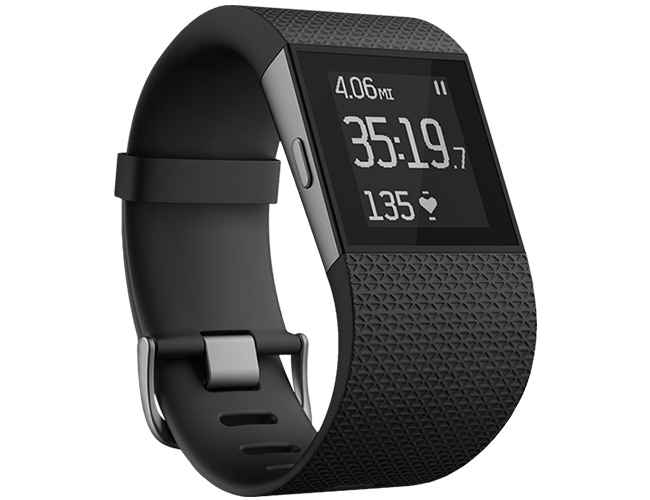
For your activities, the Fitbit Surge and the Garmin Forerunner come well recommended, but in reality, the onus lies on the app they are syncing to. Google Fit is definitely one of the most reliable and brand agnostic app that offers you some very interesting insights and graphs pertaining to your everyday workout. Get the app and use it as it is, or connect it to other apps on your phone that sync with your wearables. In either case, head over to Timeline to see your workout details – walks, runs and cycle rides – in graphs with respect to time. On the other hand, for more in depth workout analysis, Strenx by Gymwatch is very interesting, but unfortunately, it doesn’t ship to India yet.
Track Stress
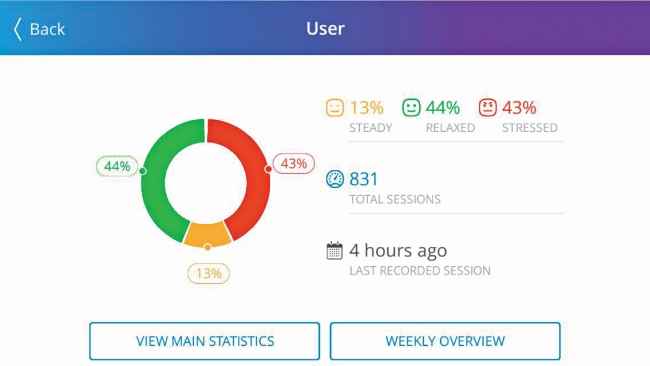
Pip is a device that is designed to help you deal with stress. And yes, it does ship to India. So when you get the device, connect it with the PIP Stress Tracker app and use it for distressing sessions. The app shows you your stress levels in the overview section, broken down into a percentage of time you were steady, relaxed and stressed respectively.
Track Game stats
As of now, there is no all-encompassing game tracking tool that can tell you detailed statistics about each and every possible game that you play. What comes close is Overwolf.
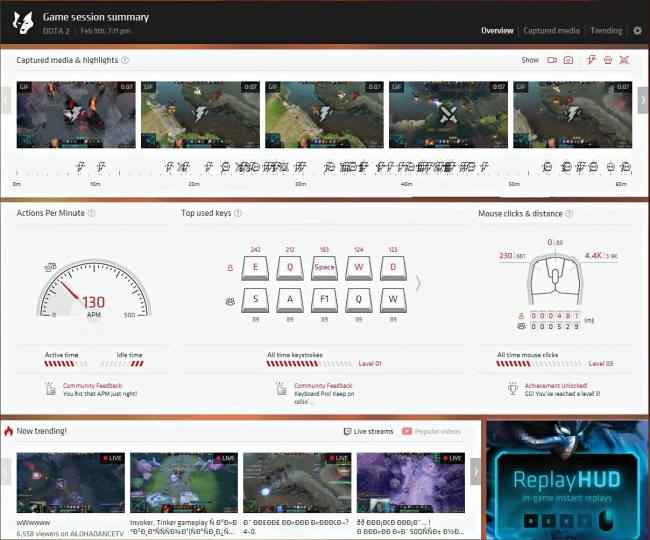
A platform that allows developers to create extensions and overlays for games, Overwolf itself has some pretty neat statistics tracking and display. Get the tool from the Overwolf website and once it is up and running, fire up any game and complete a gaming session. Once your session is done, you will be shown a Game Summary, that will include basic information like your play time today (and the week) compared to the community average. Some supported games also show additional stats. For example, CS: heatmapGO shows you your actions per minute, most used keys, mouse clicks etc. Get it to analyse your playing style, as it also shows you GIFs of your deaths, kills and other important actions in-game. Overwolf also has an app store of its own with game-specific apps. These include apps which let you track your statistics while in-game as well.
Track Social Media (Insight tools)
There are multiple inbuilt tools to analyse your own social media accounts and they are quite easy to find. For example, Facebook pages have insights as an additional tab. Instagram now offers insights via a tab you can click below every post and your overall profile at the top right. There there's Twitter analytics, Pinterest analytics and more. What we are looking at are third party tools that take these insights one step further.
Track Twitter
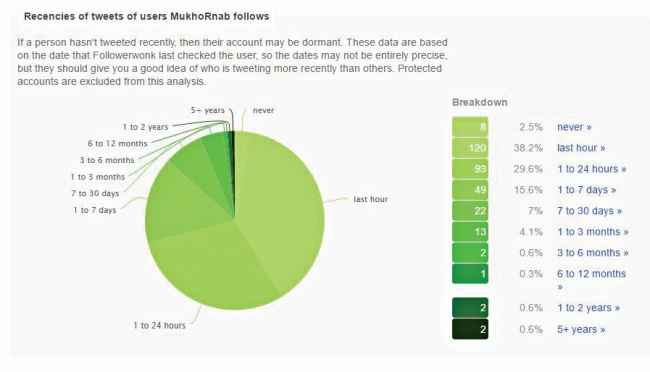
Check out Followerwonk’s free analysis tool that lets you check out stats related to any Twitter profile, including your own. And we don’t mean basic stats like follower and tweet count. Just enter the username and chose a category between ‘Followers’ and ‘Following’ and hit go – you will have a deluge of charts and graphs at your disposal regarding Active Time, Social authority, URL tweets and more.
Track Facebook
Head over to the trusted Wolfram Alpha search engine and connect it to your Facebook account. After that, simply search for ‘Facebook report’ to see expected list-like info about your profile – Recent posting history – posted links, vs. statuses vs. photos, the most frequent times and days of the week that you post, total likes and comments, average likes and comments, and average length of your most recent posts, what words you use most frequently – and a word cloud! And many more interesting visuals as well.

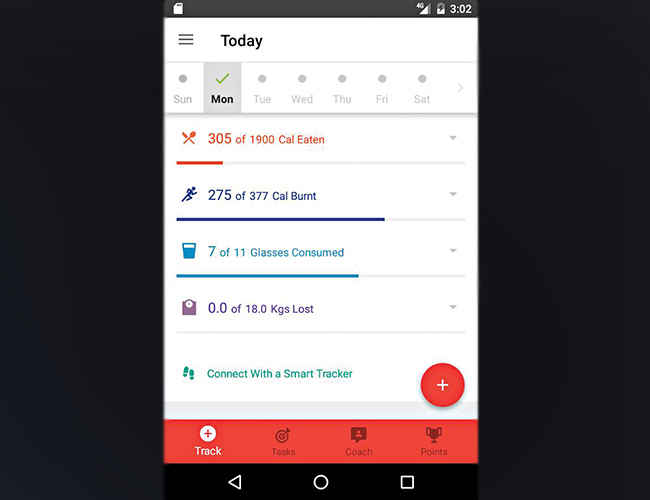
Track Food
While there are quite a few detailed food trackers for western dishes, the sheer diversity of the Indian palate makes it tough to track calories and nutrient information in your daily diet. Apps like HealthifyMe are trying to change that. While it does provide additional features like 21-day fitness plans and workout tracking via Google Fit connection, we are interested in the food tracking feature. To use it, go to the Diary section, tap on the day on the calendar, Hit ‘Track Food’ on the next section and keep logging your meals. While logging through images is a premium feature, you can dictate your meal as well. The app will provide you with a detailed breakup of nutrients in your diet as well as the top calorie contributors. Based on this, it also provides you with alternatives to reduce the calorie count in your meal.
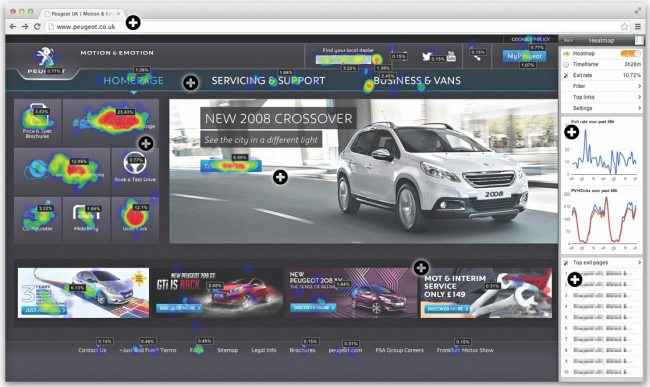
Track website usage
If you own a website and want to see a heatmap-like representation of popular content on your page, there are free tools available that let you do that. One of the popular ones is heatmap.me which lets you create an account for free. All you need to do is to add a block of code to the <head> tag section (for non-Wordpress sites) or get a plugin (for WordPress sites) and you can check a heat map overlay on your site by hitting Alt+Shift+H or using the WordPress plugin. Some of the other tools that let you do this for free are PTengine and CrazyEgg. The PTengine dashboard also shows you a lot of other useful information pertaining to your website.
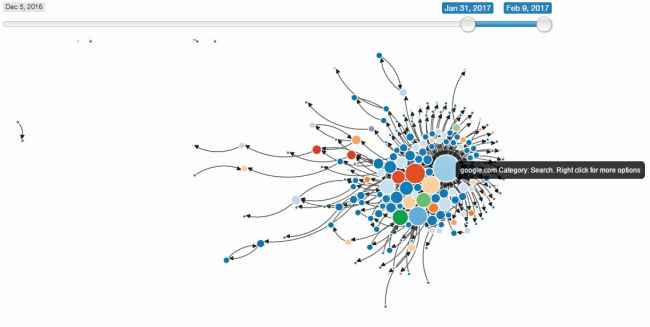
Track web browsing
While your own browsing history being revealed to the world is the stuff horror stories are made of, for some of us, getting insights based on your browsing habits is not a bad idea. Using the Chrome extension Web Historian (not available yet for other browsers, but you can always import your history into Chrome) you can get amazing visualisations of your web browsing history – browsing preferences, search clouds, a web-like visualisation of your browsing network and a time heat map of when you are most active.
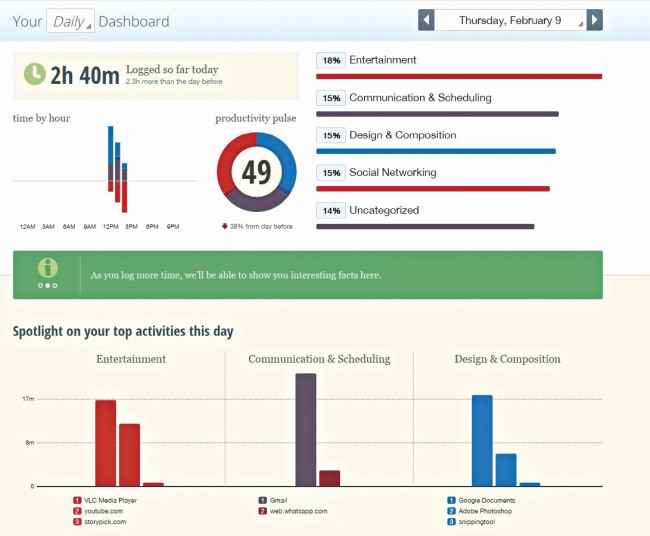
Track PC usage
A lot of us work on computers – and that means we always have a number of distractions available just a click away. So it is really important to track your PC usage to figure out where you’re spending (or wasting) time. RescueTime is an all-in-one solution to track most of your PC usage. First, you need to sign up and choose either the free RescueTime Lite plan or go ahead and get the Premium one. A simple installation and a Chrome extension later, you’ll find the RescueTime software running in the background on your computer, consuming next to no resources. After some significant usage (preferably a typical work day) head to your RescueTime Dashboard to check which applications you use the most, which websites you visit the most and more information – based on productivity, categories and more. You can even break down the overview charts to application specific reports. To do that, go to the Reports drop-down menu on the top and select ‘Applications and Websites’. Most importantly, you can compare your productive time vs your distracted time head to head. The Premium version has even richer reports.
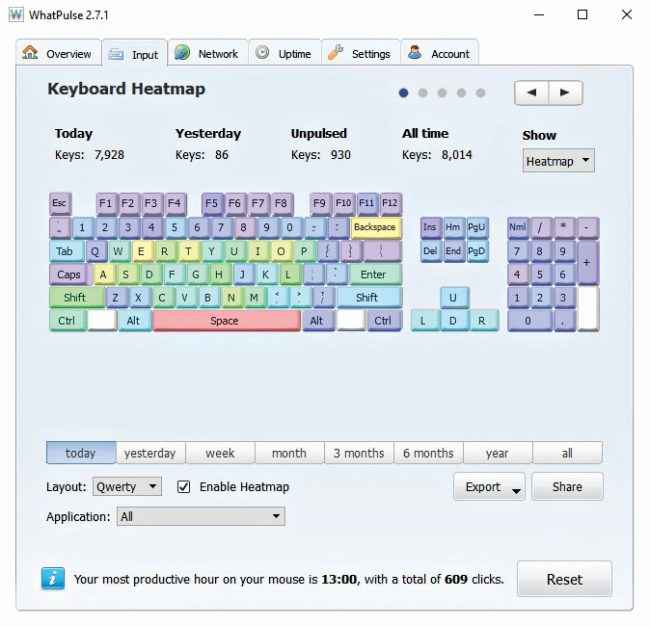
For a detailed breakdown of your peripheral usage, get WhatPulse. It is downloadable at https://whatpulse.org/downloads/ for Windows, Mac, and Linux. While the application usage data in the Uptime section is not as well presented as in RescueTime, WhatPulse’s strength lies in the Input section. Go to the tab and check out a heatmap of your keyboard, or a list of the keys used against the number of times they’ve been used, or the applications that you’ve most interacted with and more. You can also check out heat maps for your mouse usage and other similar data.
Track smartphone usage
Stats pertaining to a touchscreen, app usage, swiftkey type of keystroke analysis, and more. There have been quite a few apps that can throw data at you about your smartphone usage. A few of the interesting ones are CPU-X, that shows a CPU usage graph across frequencies, and Sensors Multitool, which shows you a live usage graph of all sensors on your phone. But what can you do with this data?
If you want data similar to what RescueTime offers for the desktop, you can actually get the RescueTime app for Android and check your app usage across categories and use types. In fact, link your smartphone app to the same account that you are using on your desktop and your overall stats will be linked too. To do that, simply sign in with the same account on your smartphone.
Track Driving |
| You can track your own, or someone else’s, driving quite easily by using an On-board diagnostics (OBD) device paired with your smartphone. Drivemate is a good option in India. You can even get an OBD connector to use a smartphone app as your OBD device. |
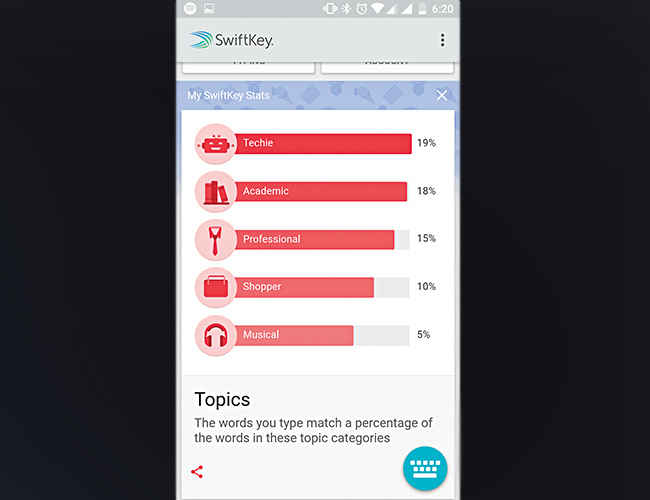
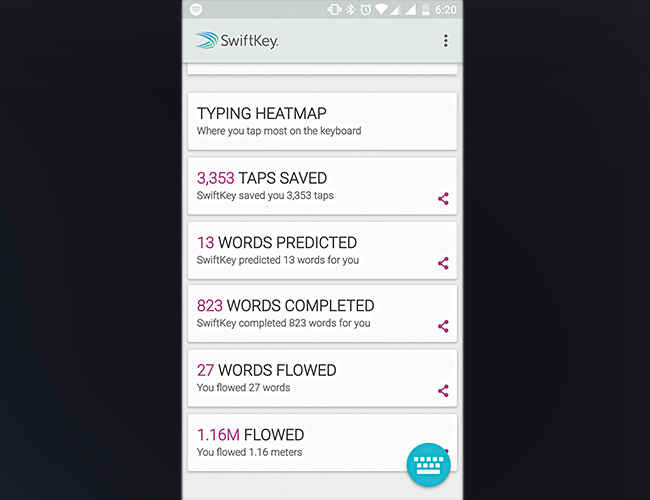
On the other hand, if you want the same key usage data that you got from WhatPulse, you need to use one of the most popular smartphone keyboards out there – SwiftKey. After you’ve used the app for a while, open the app to get a lot of insights about your smartphone typing habits – like the main topics you type about, Swiftkey usage stats, smiley usage, your signature smiley and your smartphone keyboard heat map. Sadly, you cannot use filters to limit the stats to a specific time, but this is more than what is generally available, so we are not complaining!
This article was first published in March 2017 issue of Digit magazine. To read Digit's articles first, subscribe here or download the Digit e-magazine app for Android and iOS. You could also buy Digit's previous issues here.