Everything you need to know to get started with R
Everything you need to know about the R programming language.

R is the most popular language used for data analysis, modelling and visualisation. It is great for linear and non-linear models, parametric and non-parametric tests, clustering and time-series models. It also provides advanced graphics functionality for presentations and analysis.
How was R created?
R was created in 1991 by New Zealand based Ross Ihaka (who is currently working on a new programming language that is quicker and holds more data) and Robert Gentleman. R is based on S, which was developed by John Chambers and others at Bell Labs in 1976. S was originally developed as a series of Fortran libraries to help with internal statistical requirements but was rewritten in C in 1988. This essentially makes R a 40-year-old technology. It was released to the public in 1993 and soon became the de facto language for visualisation and statistical analysis. R is free and open source, like Python. It follows the terms of theFree Software foundation under the GNU license agreement. This means that you have full access to the source code to study how programs work, adapt them your own needs, and share your improvements with other people on sites like GitHub.
R is named after the first alphabets of the first names of its creators – Ross and Robert.
This has led to the formation of an active R developer community, including a core group of 20 developers who, beginning in 1997, keep releasing updates to R every year, and provide feedback on packages you submit to the group. Packages are programs stored in script files that can run automatically without any additional coding. There are 4000 packages available on the R website at the moment, though some of these are for extremely specialised use and may only benefit one particular community, like people who sequence genomes. Whatever you need, chances are there is a package for it. The packages on the R website go through a quality control process by the core group, but you can always write your own package for personal use and share it online for others to use.
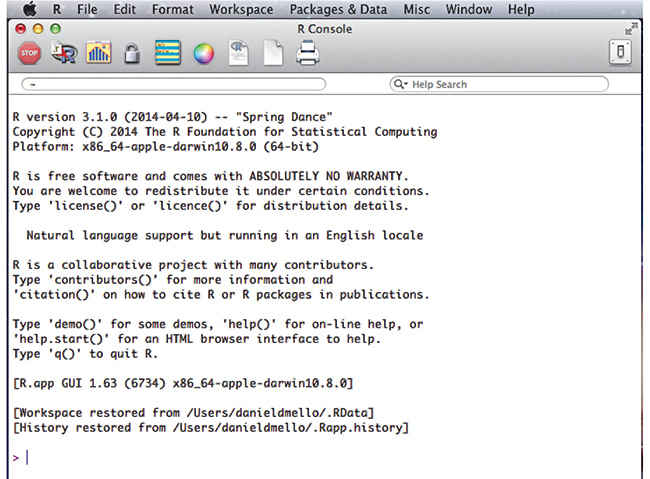
The default R language download is very basic.
Why is R so important today?
R has applications in healthcare, pharmaceuticals, biochemistry, genetics, molecular biology, computer science, AI and the social sciences. It has packages for almost anything an analyst needs. Healthcare and pharmaceutical professionals can use R to model the efficacy of drug treatments, biologists can compare and contrast genomes and therapies, social scientists can use it to model behaviour, computer scientists can use it to build better predictive algorithms, and business researchers can use it to model marketing, finance, HR and operations data to help find patterns in data and help businesses. R is specialized for these uses because it offers packages that allow users to clean data, and run models or tests on data inputted into it. The models provide output that demonstrates how well the data fits the model and also useful graphs and charts to make sense of data. This type of specialised functionality makes R an ideal language to test statistical concepts, and goes hand in hand with learning statistics.
It is no wonder then that R has become a huge success in the data sciences, surpassing even Python in utility. Of course, in all fairness to Python, which is beautiful, or the more recent Julia, which lets you work with algorithms in ways that most other languages cannot, R has been around a lot longer. At the time of its release R was the only language written exclusively for statistical analysis, being an implementation of S. This gave it an edge over other languages and tools that entered the market later. As it was the first statistical tool on the scene, it gained a loyal user base that grew comfortable with it and wrote packages to continually improve it. It has had a head start of over 10 years, and has amassed a huge library geared towards statistical programming.
But this is only part of the story. Its constantly being updated means that R has kept up with the latest statistical techniques, and in addition to basic statistical models, is also the go to program for Machine Learning techniques – pattern recognition, neural network algorithms, clustering, random forests and deep learning.
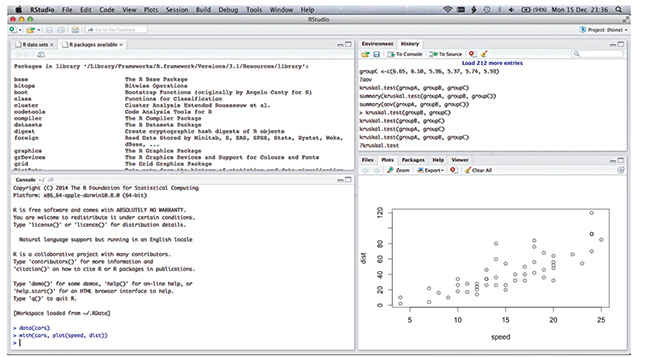
R Studio has a better look and feel to it.
What makes R better?
In a word – customisation. There are other languages and applications that analyse data, but none offer the flexibility or range in packages that R does. Applications like MATLAB, S-PLUS, Stata, SPSS and SAS hide their command prompts behind fancy GUIs. These products are owned and developed by corporations like IBM that design and copyright the source code behind their GUIs. This admittedly makes most data modelling easier as the learning curve is quicker. The user has only to learn which button to click on to get desired results along with how to interpret results. However, this only works as long as the user does not need any additional customisation requiring a change in the source code, which would be impossible to access as this is proprietary software. In this respect R has a huge advantage as it is open source and the source code is freely available.
Languages like Python, Java and Julia can also model and visualise data, but they have not been around as long as R has and so lack the large library of statistical and graphics packages that R offers. For example, Python still lacks the ability to run multiple regression scripts. It will take a few years for its library to catch up with that of R.
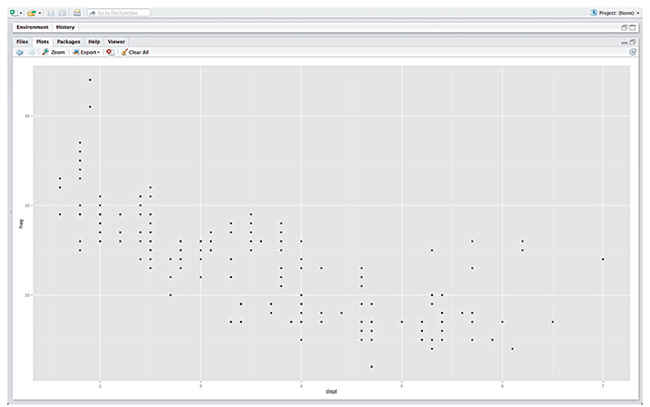
ggplot2 is one the most popular graphics packages in R.
How do you get R?
The base R programming language is available as a free download from their website. R can be installed on Windows, Mac, Unix, Linux systems and even on the PlayStation 3 (though this is only for serious geeks who don’t mind missing out on gaming time). After downloading R you can also choose to download R Studio, which has a better interface, with multiple screens to work between. You can write scripts in a separate text box, check a list of defined variables, past commands, look at graphs and help files, and code from the command prompt all at the same time. To download R, go to their website Click on ‘download R’ > click on a mirror link to download from the server closest to where you live. For India, this will be located at IIT Chennai (still referred to as Madras on the R site).
To download R Studio, go to the download page click on the latest installer for your system. Remember that you need to have already downloaded R first. The R download, called the base system, contains the R programming language, a compiler, debugger, useful datasets, and a number of common data analysis and graphics packages that you will need. You can download additional packages directly from the command prompt in R using the install.packages and library commands.
> install.packages(“package name”)
> library(package name)
Learning resources
A huge benefit to using R is the built-in help function. For example, to find out more about boxplots, open R and type “?boxplot” into the command console. You will get details about boxplot usage and arguments to pass along with examples and references. A great way to learn R is through a short interactive learning resource called Swirl that allows you to learn about basic R operations through the R console.
To install Swirl, open R > type install.packages(“swirl”) > library(“swirl”) > swirl()
A longer way to learn R applied to data Science is to work through the nine courses in the Data Science specialisation offered by John Hopkins University on Coursera.
Go to coursera website > Click Specialisations > click Data Science
If you are looking for a more basic course, try the Data Analysis and statistical inference course by Duke University on Coursera, or the Foundations of Data Analysis course by the University of Texas on EdX.
Some of the best books to use to learn R are:
Victor A. Bloomfield. Using R for Numerical Analysis in Science and Engineering. Chapman & Hall/CRC, 2014. ISBN 978-1439884485
Sarah Stowell. Using R for Statistics. Apress, 2014. ISBN 978-1484201404.
Steven Murray. Learn R in a Day. SJ Murray, 2013.
Robert J Knell. Introductory R: A Beginner’s Guide to Data Visualisation and Analysis using R. March 2013. ISBN 978-0-9575971-0-5.
J.C. Nash. Nonlinear Parameter Optimization Using R Tools. Wiley, 2014. ISBN 9781118883969.
For tutorials on 15 other hot programming languages go here.