How to analyse and use Big Data to make informed decisions
What if you never have to take another leap of faith? Data about anything and everything is at your disposal and here’s how you can use it!

Even if you don’t suffer from Decidophobia – the fear of making decisions (yeah, that’s a thing) – making decisions isn’t always easy. Especially if the circumstances are quite new and you have absolutely no experience to fall back on. Worry not, you have Big Data to your rescue which is being seen as a panacea for even something as tough as a catch-22.
Ever since we were cavemen, we rely on the most experienced amongst us to make the toughest decisions. And sometimes, it isn’t up to just one person which then requires a group of experienced managers to be consulted. It takes the cumulative experience and intuition of multiple individuals to take a high-stakes decision. The more individuals you have, the better the decision. Except such individuals don’t come cheap, but data does. And evidence supporting the increased use of data in decision making is growing by the day. Since the human element is largely removed from such decisions, the business implications from a decision based on data also ends up being more profitable.
The problem with this approach is that the amount of data generated is too voluminous and unstructured. And creating data models by training a Machine Learning algorithm takes too much time for such decision making processes to be used in untested waters. But the mere fact that companies such as IBM are investing billions of dollars into their systems should tell you a thing or two about how important a role Big Data is going to play. And close on the heels of these big organisations, even the little guys are lining up to harness the power of Big Data.
How the big guys do it
Building consumer intelligence
Businesses thrive on customers and customers like to be pampered. While you local ‘mom and pop’ stores can easily remember the names of their customers along with what’s been happening in their lives, the big corporations don’t have it that easy. Given the sheer number of customers, it’s next to impossible to remember a hundred thousand names and cater to them accordingly. So what do these big firms do? They implement CRM systems that mine customer data to generate profiles for individual customers which is then passed onto the assigned “representative”. This data allows the representative to develop a rapport akin to something that’s formed over years of conversation in just a matter of minutes.

Improve customer relations
And it’s not just about developing familiarity but this profile also allows your the representative to devise the right strategy to sell you the right product and maximise profit. This also ensures that the smaller customers aren’t alienated and consecutively don’t move to another service provider. And by sifting through tonnes of metadata generated from social media, companies can figure out what members of a particular community are fond of. This allows the hospitality industry to cater their services to a particular demographic better than they would have otherwise done.
Improving efficiency
Another aspect of businesses is operational efficiency. As companies grow, so does the complexity of its operations and operational processes need to evolve to handle this increasing complexity. And while traditional methods of improving efficiency might go a long way, changing circumstances call for even faster evolution of these methods.
More and more companies are rigging operational equipment with sensors to generate a vast amount of data. This data is then analysed using Machine Learning to figure out which areas and processes could use some improvement. This particular method has proven to be tremendously successful in improving supply chain management. Take for example the de-icing fluid incident that occurred at an airport in the US during the peak of winter which resulted in over 55 flights being cancelled as they couldn’t be de-iced and prepare for take-off. The company managing the supply of deicing fluid goofed up big time and they learnt their lesson. Each de-icing truck was fitted with sensors to monitor de-icing fluid levels. This data was then combined with weather data and flight schedules to accurately predict when the airport would run low on de-icing fluid and accordingly the company could schedule a resupply.
Even insurance companies have resorted to using big data analytics to generate user profiles which then allows them to speed up processing of claims by reducing incidences where fraud might be imminent.
Improving Healthcare
The healthcare industry has easy access to a lot of historical data. Big Data analytics are being used to sift through patient medical history to not only gain insight into diseases but to also generate a more specialised treatment for the patients, especially those suffering from chronic illnesses.
Singapore has already implemented a system which takes into account a patient’s current condition, lifestyle choices, environment, cultural specifics and other data points to help in speeding up diagnosis. The next step in such a system would be to obtain genetic data and cross reference that with diseases to extrapolate patterns and thus predict when and how a patient might get afflicted with a certain disease. This will also help reduce hospital expenses for a particular patient as the entire treatment becomes personalised, but also quicker.
Another company, 23andMe, provides at-home DNA testing kit which a customer can use. This kit generates a patient profile and uses data obtained from hundreds of such tests to tell customers if they are at risk for certain diseases.

Who’s leading the way?
Aside from the fact that software companies who initiated the big data wave there are some industries which are heavily investing in big data. The energy industry, financial services industry and the healthcare industry are the largest adopters of big data analytics – roughly 66% of management executives from these industries would label their decisions as ‘data-driven’.
What’s stopping them?
Big Data analytics is a new field and that means there exist very few domain experts who can implement data analytics systems with relative ease. And hiring such talent isn’t easy given the increasing demand for the same.
It hasn’t gone unnoticed that managerial employees view data analytics as a threat since it is the next path of evolution in making decisions. Something which managers do and thus is viewed as a threat to their livelihood.
And lastly, there’s the phenomenon of organisational silos. Big Data depends upon voluminous amounts of data from every department of an organisation being analysed and often, there is a close-minded mentality within organisations wherein employees are more cooperative with members of their own department and a lot less while interacting with those from other departments. This mindset trickles down in the form of different styles and formats being implemented for data in different departments. So when you pool all the data together, you are left with unstructured data rather than coherent data which requires more effort to be effectively analysed using machine learning.
Trying your hand at Big Data analytics
Now that you’re convinced about the merits of Big Data analytics, you are probably eager to try your hand at doing some yourself, right? While we did mention that lack of talent was one of the hampering factors towards the greater adoption of Big Data analytics, we should have mentioned that big corporates have highly unstructured data and making sense of that requires experience.
So let’s scale things down a bit and apply a little bit of Big Data analytics to more simpler data sets. Let’s take a survey or perhaps observations pertaining to a scientific study. We’re going to be analysing a sample data set involving an experiment performed in 1979 by M. M. King studying the effect of different diets on rats. Over time the rats developed cancerous tumours so we need to figure out which diet affected the rats the most or the least, i.e. in statistics, this is known as Survival analysis. Speaking of statistics, the following explanation will be a little heavy in statistics terminology so you might as well be prepared to do your research. We will be using IBM SPSS to perform a set of operations on a data set. The data set can be obtained here.
Thankfully, there is a statistical method known as Kaplan-Meier to estimate this very data.
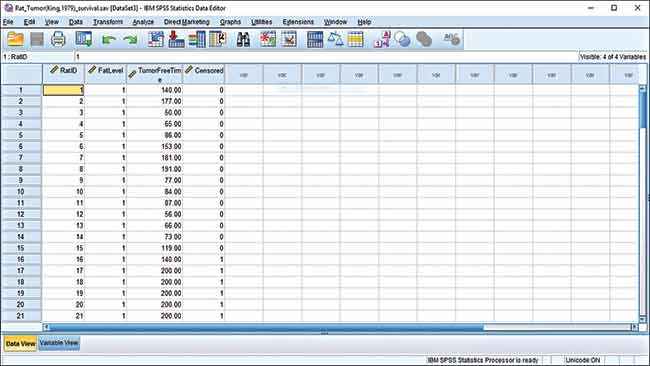
Let’s take a look at the data first. We have four columns, the first column is for identification, the second column is diet type, third column indicates the time period for which the rats were cancer-free and the last column indicates if the data was censored. Censoring is a term used in statistics to indicate if a value is partially known. There are sub-classifications on censoring but we won’t be getting into that level of detail. All that we need to know is that if the value in the censored column is 0 then it was uncensored data while a value of 1 indicates censored data. The experiment had 90 rats which were, in three batches of 30, fed three different diets with varying levels of fats. Fat level 1 indicates that the diet was low fat, level 2 indicates saturated fat diet and fat level 3 indicates an unsaturated fat diet.
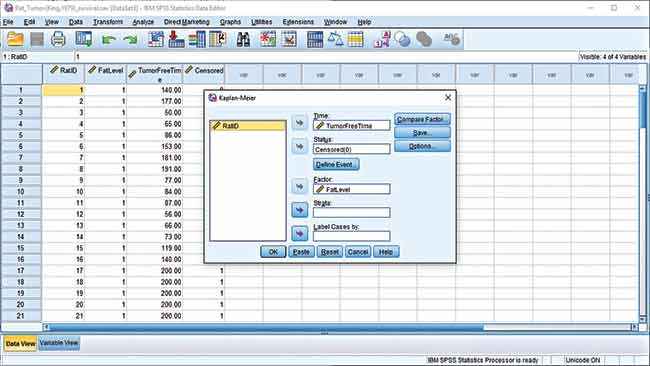
Fire up SPSS and open the provided data set. If you wish to understand how Kaplan-Meier estimator is applied to data sets then this video should help you out. Once you have the data loaded up, click on Analyze > Survival > Kaplan-Meier and a dialog box should pop up asking for the parameters. Here, select ‘TumorFreeTime’ as input for the ‘Time’. Choose ‘FatLevel’ as input for the ‘Factor’ and then select the ‘Censored’ variable as input for the ‘Status’. You will need to define the event for ‘Status’ so click on ‘Define Event’. You now have three ways to define the ‘Censored’ value. As pointed out earlier, is the Censor value is 0 then the data is complete and the event has taken place. So we will be selecting ‘Single value’ as the manner in which we define the event and input ‘0’ as the value. Click on Continue.
Now you need to compare the factor which is, in this case, the FatLevel variable. You are presented three different test statistics to compare the factor, we will be selecting Log rank, Breslow and Tarone-Ware. Click on Continue. Now click on Options to select which statistics and graph plots should be generated. Select Survival tables, Mean and Median survival, Survival plot and Hazard plots and then click Continue. Click OK to generate your report.
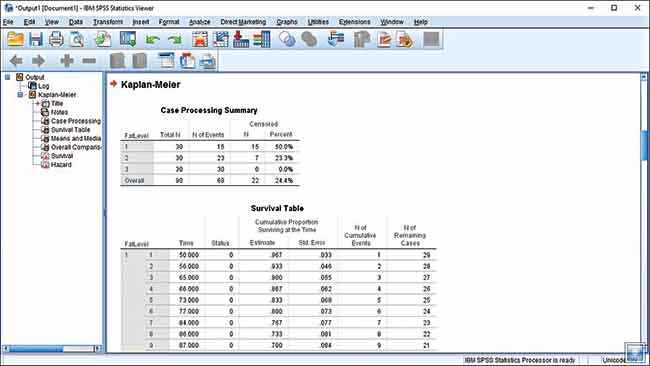
You are first presented with the Case Processing Summary which tells us that the rats that were on the low fat diet survived the longest and had the lowest cases of cancer developing. Fifteen rats did not develop tumours on FatLevel 1 diet, seven rats did not develop tumours on FatLevel 2 diet and all rats on FatLevel 3 diet ended up with tumours. As you scroll down, you will come across the Survival Table which indicates at which point in time that the subjects developed tumour. The Means and Medians table shows the average time before rats on a certain diet would develop tumour.
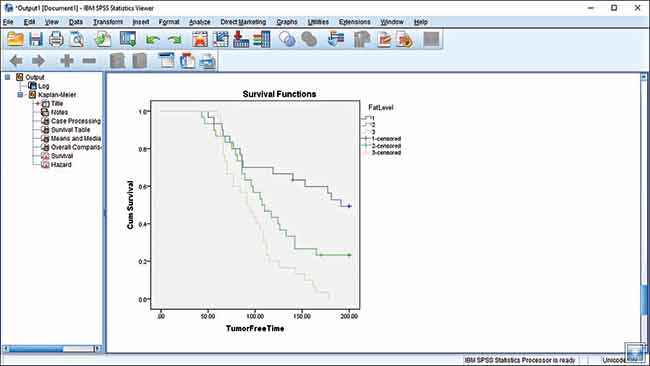
And if tables aren’t your thing then we’ve the same data in the form of easy to understand graphs. Each coloured line here is a cohort, or data pertaining to a group of test subjects. The blue line shows rats on FatLevel 1 diet, green shows FatLevel 2 and the yellow line shows the unfortunate souls on FatLevel 3 diet. Based on the test data, you can conclude that unsaturated fat isn’t good for rats.
You should know that we’ve used structured data for the above example and you’re unlikely to get such structured data in real life situations, hence, the need for experienced data scientists to design data models for Big Data analysis.
Something a little less complicated
If running your own experiments with SPSS or any other Big Data analytics tool isn’t something you signed up for then you’d be surprised to know that you’ve probably been using or have reaped the benefits of services that use Big Data analytics for a few years now. If you’ve written any online article then you’d surely have performed a little Search Engine Optimisation and looked for keywords for your article. Well, you used Google to sift through millions of web pages to find keywords most appropriate for your article and that’s Big Data analytics in action.
Have you seen those little factoids that pop onto the TV screen while enjoying your favourite sports match? How do you think those statistics are generated? Someone has to manually feed a key moment into the analytics system and the system will return those little facts. Now go on, and get cracking!
This article was first published in October 2016 issue of Digit magazine. To read Digit's articles first, subscribe here or download the Digit e-magazine app for Android and iOS. You could also buy Digit's previous issues here.