How to use Intel XDK plugins for Sublime Text

Rejoice Sublime Text* users, you can now automate Intel® XDK tasks directly from Sublime Text. With the new plugin for the Intel XDK, you can edit your code in Sublime Text and launch the editor, push to the cloud or device for testing, or start the profiler.
Grab the plugins from _ . Make sure you have the correct Sublime Text* version. Next, install the plugin for Sublime Text. It is not currently available for package control.
You should extract the "XDK" folder to plugin's folder of your Sublime Text* and restart it. Usually folder with plugins is located at
- Windows: %APPDATA%\Sublime Text X\Packages (put XDK folder here), where X is 2 or 3 depending on your sublime's version.
- OSX: ~/Library/Application Support/Sublime Text X/Packages , where X is 2 or 3.
- Linux: usually ~/.Sublime Text X/Packages, where X is 2 or 3, but may vary.
After the plugin is installed, restart Sublime Text.* You will now have a new menu at the top titled "Intel® XDK". This menu has four additional sub menus' to interact with the Intel XDK
- Emulator
- Test
- Debug
- Profile
Using the Sublime Text* plugin
Open up your Intel XDK project in Sublime Text*. Your project root folder must have the _project_.xdk file in it, otherwise it cannot communicate with the Intel XDK. Select your default HTML file, usually index.html, and the menu items will be available for use. Whenever you execute an Intel XDK command, it will make sure you current project is the project you have opened in Sublime Text.
Emulator
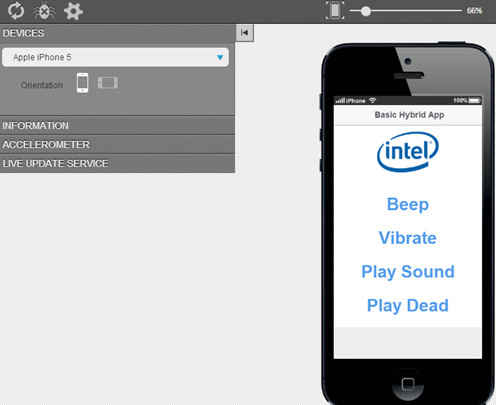
The emulator sub menu will let you run your app in the emulator. You can also launch the emulator in a separate window. You can find more instructions on using the device emulator at https://software.intel.com/en-us/node/514754
Test
There are two options in the test menu. The first option, push files to testing server, will push your current project to the cloud to test in App Preview. You can then open up App Preview on your device and select the project, or switch to the Intel XDK and find the QR code to launch your app.
The second option will launch your app directly on device through the Debug Tab. You can test on an Android* 4+ or iOS* device. For more information on testing and debugging, see https://software.intel.com/en-us/html5/intel-xdk-debug-and-test-overview#TestTab
Debug
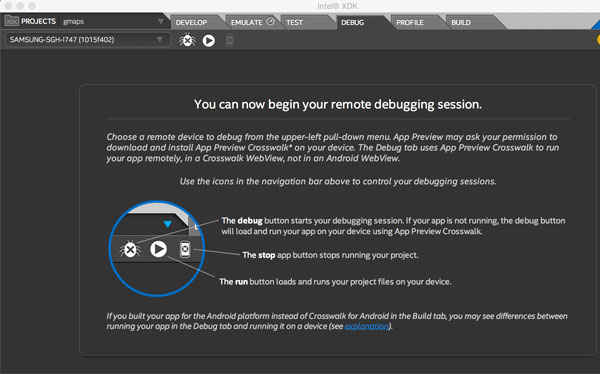
Here you can debug your app on device with a wired USB connection. This is currently enabled for Android* 4+ or iOS* devices. You have three options
- Start the app on the device (no debugging)
- Debug the app on device
- Stop the app on the device
Please see here for more information on the debug tab.
Profile
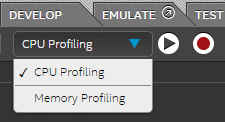
This will allow you to profile your app on an Android* 4+ device. The memory profile tool provides more information then regular Chrome* Developer Tools, including exact locations in the source code of where the performance issues are.
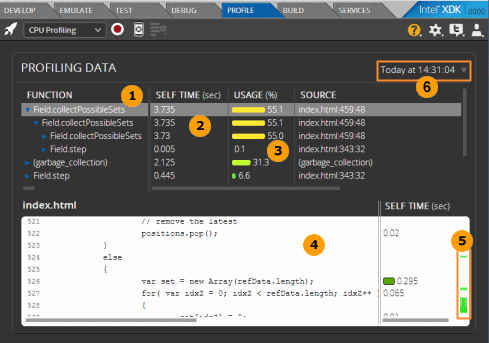
Please see here for more information on the profile tab.
For more such Android resources and tools from Intel, please visit the Intel® Developer Zone