Pre-Processing GeoTIFF files and training DeepMask/SharpMask model

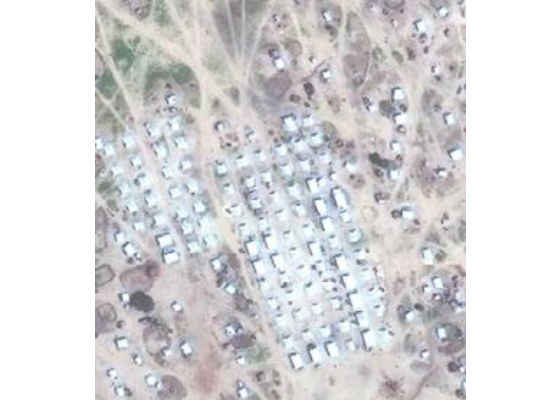
For this project, UNOSAT is responsible for providing us with satellite images. At first, we will be using GeoTIFF files of Muna refugee camps, Nigeria. You can find the map analyzed by the UN on this link. Other than these images we were also provided with shapefile and geodatabase files.
We can handle images and data within a single file using a flexible and adaptable file format known as TIFF. Using TIFF, we can define the geometry of the image by including the header tags such as size, definition, image-data arrangement and applied image compression.
GeoTIFF is a type of TIFF file format. It is a public domain metadata standard which allows relation between internal coordinate system of a map with ground system of geographic coordinates (e.g. longitudes and latitude information) to be embedded within a TIFF file.
I am using shapefile to extract label information for my dataset. Shapefile is a popular geospatial vector data format for geographic information system (GIS) software. Using shapefile, we can spatially describe vector features e.g. lines, points and polygons can represent rivers, shelters or other different features.
With these things, we want to generate annotations/labels for our dataset that follows the deepmask annotation format. I have already shown deepmask annotation format in the second blog. Firstly, we need to generate tiles from the given GeoTIFF files and then we will create labels for each tile.
Tile Merging:
To generate tiles, I was provided with seven GeoTIFF files of the refugee camp. The first step was to merge these satellite images into one. To do this we can follow any of the approaches given below:
Using QGIS:
You can install QGIS by following steps given below:
sudo add-apt-repository ppa:ubuntugis/ubuntugis-unstable
sudo apt-get update
sudo apt-get install qgis
After installation, you need to follow this simple tutorial.
Using GDAL python library:
You can install GDAL by following the steps mentioned below:
sudo add-apt-repository ppa:ubuntugis/ppa && sudo apt-get update
sudo apt-get install gdal-bin
After installation, you can use one of the following commands:
Gdal_merge.py -ot Byte -o mergedMuna.tif -of GTiff Muna1.tif Muna2.tif Muna3.tif Muna4.tif Muna5.tif Muna6.tif Muna7.tif -co COMPRESS=DEFLATE -co PREDICTOR=2 -co BIGTIFF=YES
I will recommend the below approach as it produces the desired merged TIFF most efficiently.
sudo add-apt-repository ppa:ubuntugis/ppa && sudo apt-get update
sudo apt-get install gdal-bin
Python shapefile library:
The Python Shapefile Library (pyshp) provides read and write support for the Shapefile format can be installed using the following command:
pip install pyshp
After installation, to parse the given shapefile follow the steps mentioned below:
First, you have to import the library
import shapefile
For reading the shapefile create a “Reader” object and pass it the name of your existing shapefile. The shapefile format consists of three files. You can simply specify the filename with the .shp extension.
sf = shapefile.Reader("Muna_Structures.shp")
To get the list of geometry of shapefile you can use shapes() method. The shapes method returns a list of shape objects where each shape object describes the geometry of each shape record.
shapes = sf.shapes()
To find the number of shape objects in the given shapefile we can simply use len() method.
len(shapes)
To iterate through the shapefile’s geometry you can use the iterShapes() method.
len(list(sf.iterShapes()))
Each shape record can consist of following attributes:
shapeType: returns an integer which defines type of the shape.
shapes[1].shapeType
Types of shapes with their respective integer values are given below:
shapefile.NULL = 0
shapefile.POINT = 1
shapefile.POLYLINE = 3
shapefile.POLYGON = 5
shapefile.MULTIPOINT = 8
shapefile.POINTZ = 11
shapefile.POLYLINEZ = 13
shapefile.POLYGONZ = 15
shapefile.MULTIPOINTZ = 18
shapefile.POINTM = 21
shapefile.POLYLINEM = 23
shapefile.POLYGONM = 25
shapefile.MULTIPOINTM = 28
shapefile.MULTIPATCH = 31
bbox: If the shape type contains multiple points this tuple describes the lower left (x,y) coordinate and upper right corner coordinate. You can use this information to get a complete box around the points.
If shapeType == 0 then an Attribute Error is raised.
bbox = shapes[1].bbox
parts: This attribute simply group collections of points into shapes. If the shape record has more than one part then this attribute contains the index of the first point of each part. If there is only one part then a list containing 0 is returned.
Shapes[1].parts
points: Returns a list containing an (x,y) coordinate for each point in the shape.
len(shapes[1].points)
You can read a single shape by calling its index using the shape() method. The index for the shape count starts from 0. So, to read the 5th shape record you would use index of 4.
s = sf.shape(4)
Simple Visualization:
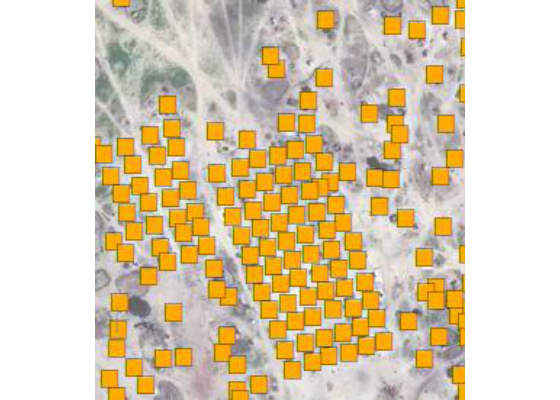
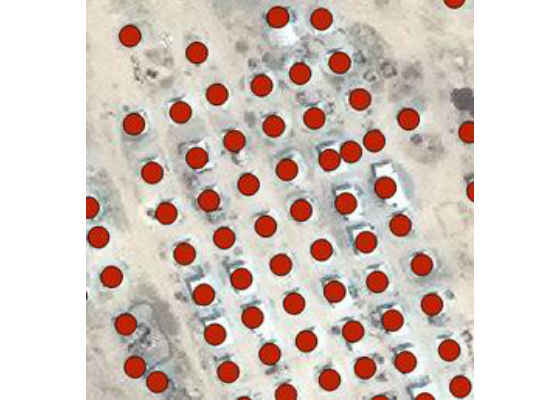
To understand how shape objects in the shapefile represent shelters or other different features, you can visualize shape objects overlaid on merged TIFF in QGIS.
To do this, in the menu bar add the raster layer and then select merged image, drag and drop shapefile, it will result in all shape objects pointing at respective shelters like the images given below:
Tile Generation:
Now we have to split our merged image into tiles of a specific size as required by DeepMask/SharpMask model. We are generating tiles of size 224 x 224. To do this you can follow one of the following approaches:
ImageMagick method:
convert mergedImage.tif -crop 224×224 +repage +adjoin muna_%d.jpg
Sliding Window Method:
I created a python script to generate tiles by sliding window of size 224 x 224 over the merged image. I am sliding my window 50 pixels in the x direction and 50 pixels in the y direction. This results in the generation of significantly higher number of overlapping tiles as compared to ImageMagick method.
Now, I have enough number of tiles with their geometry information present in shapefile.
Problem (DeepMask annotation format requires Bounding Box):
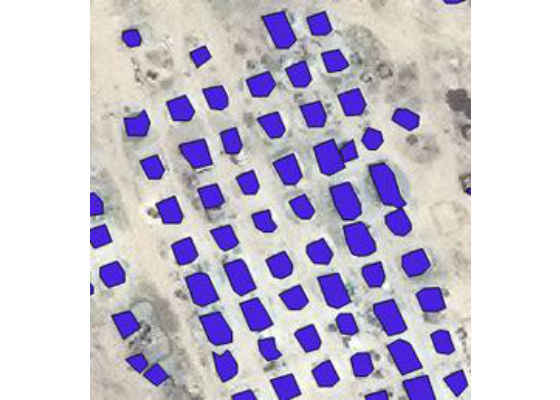
DeepMask annotation format, as shown in second blog, does not work with sole points but requires bounding box information, so I should modify my shapefile and change points to polygons.
I can modify my shapefile using QGIS. I can create a radius of influence around each point by following the steps mentioned below:
Start by buffering your points:
Go to the menu bar
Vector -> Geoprocessing Tools -> Fixed Distance Buffer -> Set Distance
I am setting the distance to 0.00002.
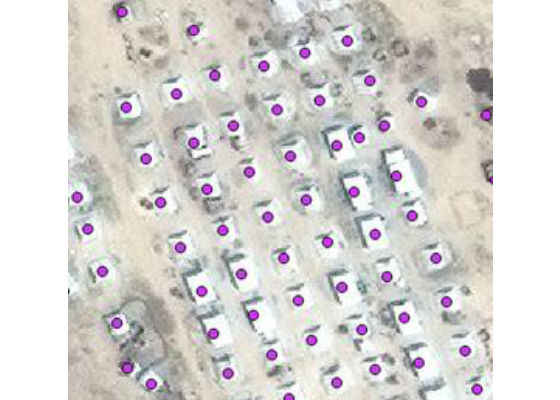
This gives me the radius of influence around that point. Now I have bounding box information for each shape. The resulted polygons are shown below:
I can also perform the above procedure without modifying my shapefile by creating a python script.
As in our shapefile each shape consists of just a single point and no bounding box for each shelter. I can take this single point as center and then can define my radius empirically.
We can get x and y points around any given point with an empirically defined radius by doing the following steps:
(i is in between 0 to 360)
x = math.floor(radius * math.cos(i*(math.pi/180)) + XofPoint)
y = math.floor(radius * math.sin(i*(math.pi/180)) + YofPoint)
segmentation[0].append(x)
segmentation[0].append(y)
After converting a single point to multiple points, I can now add these points in the annotation file as segmentation pixels. Further, now I have bounding box pixels available too.
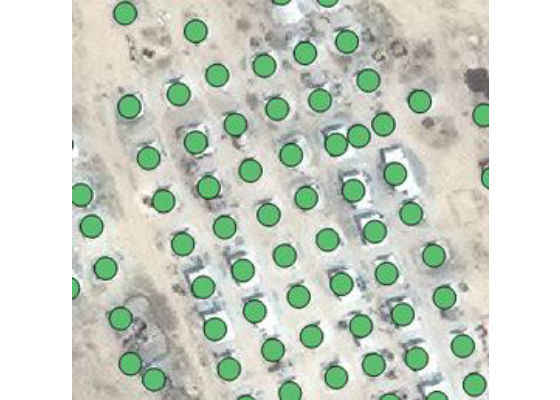
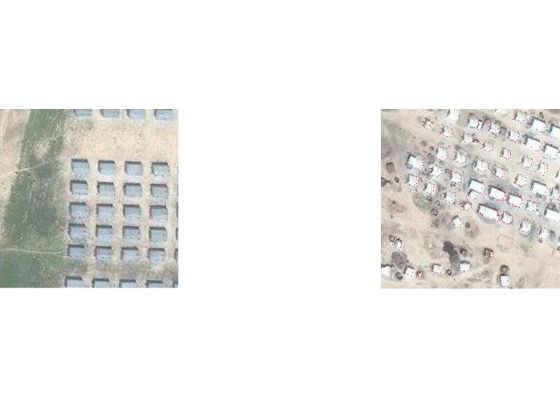
Problem: (All circles will be of equal length)
Our radius of influence around all points will be of same area no matter how much a shelter structure is bigger or smaller. So, for small shelters it will include a considerable amount of background region. And for bigger shelters may be some of the region of shelter lies outside the boundaries of the radius. So, learning problems!!
As seen in the below example:
So, the next thing that I can do is to manually define the labels for each shelter. To do this you have to create your own shapefile by doing the following steps:
Choose New → New Shapefile Layer from the Layer menu
Select polygon as type.
Choose same CRS (coordinate reference system) as of our given shapefile. In our case it is WGS84.
Under new field, type name of new field (In my case shelters), click [Add to fields list] and then click [OK]. You will be prompted by the Save As dialog. Type the file name ("myShapeFile") and click [Save]. You will be able to see the new layer in the Layers list.
Now click on the layer name that you have just created in the Layers Panel. Click the Toggle editing option on the toolbar. Now our layer is editable. Now, click on the Add Feature icon. When you do this, the cursor will change from an arrowhead to a different icon. Left-click on your first shelter to create the first point of your new shape. Keep on left-clicking for each additional point you wish to include in your polygon. When you have finished adding points (i.e., the polygon represents the desired shelter area), right-click anywhere on the map area to confirm that you have finished entering the geometry of your feature. This will result in opening of the attribute window. Input the name you want for your polygon (e.g.,"shelter1"), and click [OK].
Then, click on
Save Layer Edits (either on the toolbar or under the Layer menu). Saving the project directly while you are editing your layer will not save unsaved edits and so you should explicitly save the edits in layer otherwise all efforts will be lost.
Comparison of modified shapefile with the older shapefile is given below:
At this time, I have an appropriate shapefile and enough number of tiles. So, the next step is to create an annotation/label file for our dataset.
Annotation File Creation:
To create annotation/label file for our dataset, you can follow the steps mentioned below:
Split shape objects from shapefile in three parts appropriately: For testing, training and validation.
Load merged image using geoio library. You can do this in the following way:
mergedImage = ‘merged.tif'
img = geoio.GeoImage(mergedImage)
For training, out of 2403 shapes, I am parsing 1803 shapes. As we have generated our tiles using overlapping approach, each shape lies in several tiles.
Oru shapefile was created by using wgs84 coordinate reference system, so each shape point is represented by longitudes and latitudes.
To convert longitudes and latitudes to pixels (rasterization) we can use geoio library. Since we have already loaded our merged image in geoio img object, now we can do this:
For training, out of 2403 shapes, I am parsing 1803 shapes. As we have generated our tiles using overlapping approach, each shape lies in several tiles.
Oru shapefile was created by using wgs84 coordinate reference system, so each shape point is represented by longitudes and latitudes. To convert longitudes and latitudes to pixels (rasterization) we can use geoio library. Since we have already loaded our merged image in geoio img object, now we can do this:
img.proj_to_raster(shapeLongitutde,shapeLatit
After converting geo coordinates to pixels in the shapefile, we can get our labels for each shelter using these points but these points are according to merged image. We need to localize them according to each tile.
To do this, at first, we have to find all tiles in which the given point can be present. After identifying tiles, we need to find where in the merged image lies the upper left corner or origin (0,0) for corresponding tiles.
After finding upper left corner pixels for the tiles in the merged image we can simply subtract these pixels from corresponding shape points that are present in these tiles to get the local coordinates for each shape point.
Now we can simply include these points in the segmentation key of data header in json file.
Similarly we can add bounding box information for each shape and can add this in bbox key of data header in json file.
Add appropriate information in all other keys of data header.
After each iteration we need to dump data in json object:
img.proj_to_raster(shapeLongitutde,shapeLatit
After all the iterations are completed we need to dump/write jsonData object in json file:
d = jsonData
d = json.loads(d)
with open('instances_train2014.json','w') as outfile:
json.dump(d,outfile)
Similarly, we have to produce json file for validation dataset.
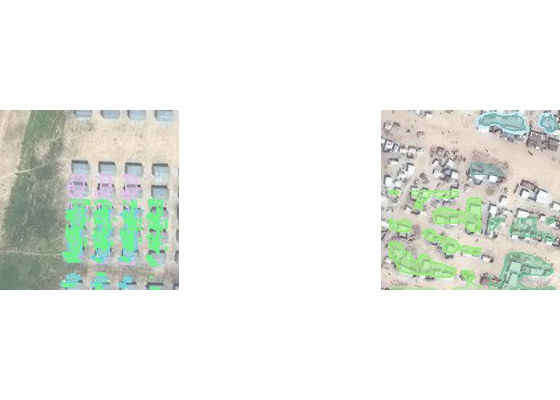
To evaluate the validity of generated labels, I parsed my JSON file and checked for various tiles to see how my labels look.
We can do json file parsing in the following way:
import json
d = open('instances_train2014.json').read()
d = json.loads(d)
d.keys()
d["any key name"]
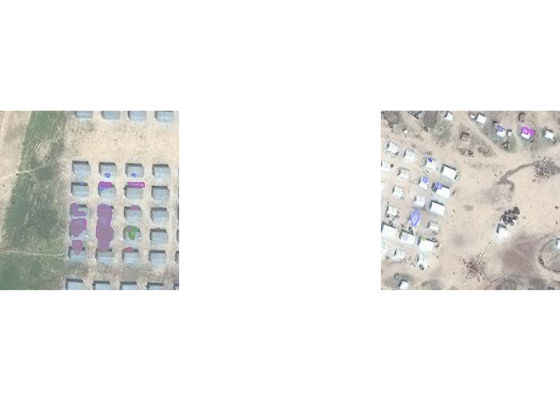
Two tiles with labels overlaid can be seen in the images shown below:
After following the directory structure as explained in the second blog we can start our training using the pretrained deepmask model with our own dataset using the command given below:
luajit train.lua -dm /path/to/pretrained/deep mask
If you want to use pretrained SharpMask model or to resume training at any checkpoint model you can do this by the following command:
luajit train.lua -reload /data/mabubakr/mlMask
This command will lead to an error of not finding a required class. To resolve this add the following line of code before line 63:
trainSm = true
After 3 days of training and more than 350 iterations with learning rate of 1e-5, I am getting the results shown in the fig.
To check results run the following command:
luajit computeProposals.lua /path/to/evaluate/own/pretrained/model
After 200 iterations these are the evaluation results that I am getting:
After 350 iterations I am getting the following evaluation results:
In my opinion, DeepMask/SharpMask did not work well with satellite images. At later stages of training, evaluation results do not show any labels at all. In the future, we are going to evaluate General Adversarial Network based pix2pix algorithm.
Finally, I would like to thank my regular supervisor from CERN OpenLab Taghi Aliyev, my supervisor from UNOSAT Lars Bromley and my supervisor from crowdAI S.P. Mohanty for all of their help and guidance.
For more such intel IoT resources and tools from Intel, please visit the Intel® Developer Zone
✅ Thank you for completing the survey!
Source:https://software.intel.com/en-us/blogs/2017/09/08/pre-processing-geotiff-files-and-training-deepmasksharpmask-model