Enhancing Outlier Detection with Intel Data Analytics Acceleration Library

Introduction
How do credit card companies detect fraud or abuse? How do network administrators discover intrusions? How do scientists know whether or not their experiments run correctly?
In order to do these things, they analyze the data set and look for data points that are out of normality. For example, credit card companies look for unusual, high charges in certain transactions or strange buying behaviors. These actions might indicate that a credit card has been stolen. Network administrators search in the log files for irregular activities on the network, like an unusual load from some locations or network access from a foreign IP address, which are good indications of potential network intrusion. Similarly, scientists look to see whether data is out of the normal or expected ranges as an indicator that an experiment is not running correctly.
These types of unusual or irregular activities are called outliers or anomalies. This article describes different methods to detect outliers1 in the data and how the Intel® Data Analytics Acceleration Library (Intel® DAAL)2helps optimize outlier detection when running it on systems equipped with Intel® Xeon® processors.
What is an Outlier?
An outlier is a data point that is significantly different (abnormal or irregular) or deviates from the remaining data (see Figure 1).
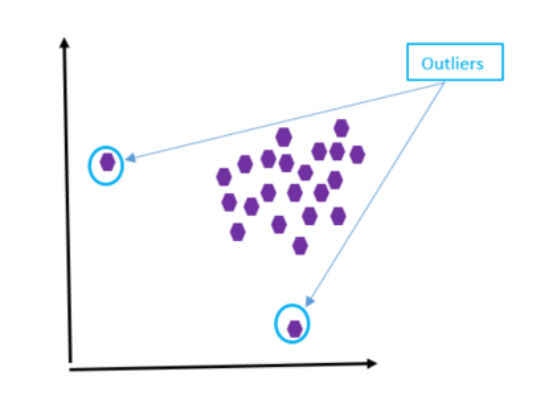
Figure 1: Outlier case #1.
Each purple dot represents a data point in a data set. From the graph, the two data points are considered outliers since they are very far away from the rest of the data points.
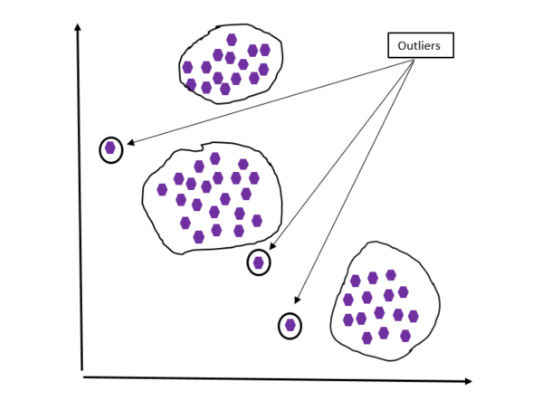
Figure 2: Outlier case #2.
Figure 2 shows another case of outliers. In this case a data set is grouped into three groups (clusters). Any data points that lie outside the groups are considered outliers.
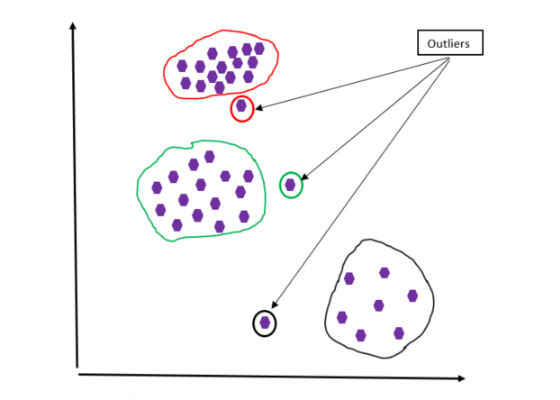
Figure 3: Outlier case #3.
Figure 3 shows another case of outliers. Although the data sets are grouped into different groups, this case is different from that in Figure 2 because of the density of the data points. In Figure 2, data points are almost uniformly distributed in the groups, while those in Figure 3 have different density.
What Causes Outliers?
Outliers can be both good and bad. By detecting irregular activities (outliers) in the network, network administrators can potentially discover and prevent data intrusion. On the other hand, detecting outliers and eliminating them can help eliminate or minimize the impacts in the calculation results. Outliers can skew and mislead the training process of machine learning3 algorithms, resulting in longer training times and less accurate models. For example, in the case of a K-means clustering algorithm, outliers in the data set will pull the centroid of a cluster away from its intended location.
Common outlier causes include the following:
- Data collection error: The data collection devices can collect unusual data due to noise.
- Data entry error: Incorrect data is entered. For example, mistyping the sale price of a house in a specific neighborhood can cause the price of that house to be out of the average range of house prices of that neighborhood.
- Selection type error: For example, consider high-school student heights. Some high school basketball students are very tall comparing to their fellow students. Those student heights are outliers. To be correct, the heights of the basketball students should be measured separately from the overall student population.
- Conversion error: Manipulation or extraction errors when extracting data from multiple sources can cause outliers.
Methods of Detecting Outliers
The common way to detect outliers is to plot the data set and then look at the graph, similar to those shown in figures 1–3.
In the second edition of the book Outlier Analysis,4 Charu C. Aggarwal provides the following outlier detection methods:
- Probabilistic models
- Linear models
- Proximity-based models
- High-dimensional outlier detection
Applications of Outlier Detection
Because outlier detection methods can detect strange or abnormal data, they can be used to:
- Detect irregular activities and strange addresses when analyzing network security
- Identify credit card fraud by observing unusual buying patterns or very high-charge transactions
- Diagnose potential patient health problems by spotting unusual symptoms or test results from the patients
- Identify good players in sports when analyzing their data that is abnormal compared to their peers
These are just some of applications of the outlier detection methods; there are many more.
Intel® Data Analytics Acceleration Library
Intel DAAL is a library consisting of many basic building blocks that are optimized for data analytics and machine learning. These basic building blocks are highly optimized for the latest features of latest Intel® processors. In this article, we use the Python* API of Intel DAAL to illustrate how to invoke outlier detection functions. To install it, follow the instructions in the Intel DAAL documentation.5
Using the Outlier Detection Method in the Intel Data Analytics Acceleration Library
From the Intel® DAAL manual, the following paragraph describes what a univariate outlier is and the formula to define the outlier region:
“Given a set X of n feature vectors x 1= (x 11,…,x 1p ), …, x n = (x n1,…,x np ) of dimension p, the problem is to identify the vectors that do not belong to the underlying distribution. The algorithm for univariate outlier detection considers each feature independently. The univariate outlier detection method can be parametric, assumes a known underlying distribution for the data set, and defines an outlier region such that if an observation belongs to the region, it is marked as an outlier. Definition of the outlier region is connected to the assumed underlying data distribution. The following is an example of an outlier region for the univariate outlier detection:

where m n and σ n are (robust) estimates of the mean and standard deviation computed for a given data set, α n is the confidence coefficient, and g (n, α n ) defines the limits of the region and should be adjusted to the number of observations.”
This section shows how to invoke the outlier method in Python6 using Intel DAAL.
The following steps are used to invoke the univariate outlier detection algorithm from Intel DAAL:
1. Import the necessary packages using the commands from and import
1. Import the Intel DAAL numeric table by issuing the following command:
from daal.data_management import FileDataSource, writeOnly, DataSourceIface, BlockDescriptor_Float64
2. Import the univariate outlier detection algorithm using the following commands:
from daal.algorithms.univariate_outlier_detection import InitIface, Batch_Float64DefaultDense, data, weights
2. Initialize the file data source if the data input is from the .csv file:
DataSet = FileDataSource(
trainDatasetFileName, DataSourceIface.doAllocateNumericTable,
DataSourceIface.doDictionaryFromContext
)
Load input data:
DataSet.loadDataBlock()
nFeatures = DataSet.getNumberOfColumns()
4. Create a function algorithm:
1. First create algorithm object
algorithm = Batch_Float64DefaultDense()
2. Pass the data set to the algorithm
algorithm.input.set(data, DataSet.getNumericTable())
5. Compute the outliers and get the results:
results = algorithm.compute()
6. The results can be printed using the following command:
printNumericTable(results.get(weights), “outlier results“)
Note: some common data sets can be found at the UCI Machine Learning Repository.7
Conclusion
Outlier detection plays an important role in fraud detection, network security, and more. Intel DAAL optimizes the outlier detection methods by taking advantage of new features in future generations of Intel Xeon processors when running the methods on computer systems equipped with these processors.
For more such intel IoT resources and tools from Intel, please visit the Intel® Developer Zone
Source:https://software.intel.com/en-us/articles/enhancing-outlier-detection-with-intel-data-analytics-acceleration-library